|
Household IncomeDue to assumed under-reporting of household income, household wealth rather than income, has been chosen as main point of reference for household economic resources. For measurement of recent changes in household economic resources, wealth is, however, a less suitable measure due its relative stability over time. The first part of this section thus uses (self-reported) changes in household income to chart the development of household economic resources in the occupied territories since the Gulf War.Even though the survey does not aspire to record exact levels of household income, the prevalence of various types of household income has still been recorded. The second part of this section will thus deal with various household income types, in particular how different income types are correlated with the Head of Households's labour activity and household wealth.
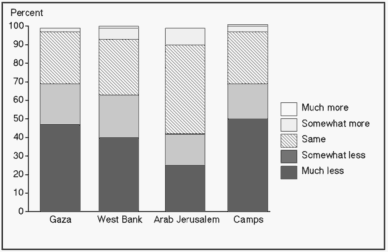
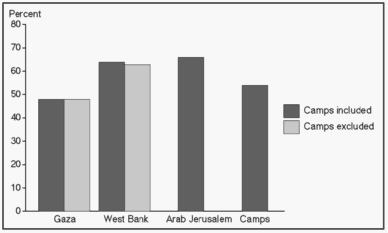
Recent Development of Household Income in the Occupied Territories8 The outbreak of the intifada, characterized by frequent strikes and curfews, has initiated a period of declining household income in the occupied territories. During the Gulf War, a six week curfew paralyzed all economic activity in Gaza and the West Bank. After the Gulf war, new restrictions on employment in Israel deprived many households of their main source of income. Remittances and financial assistance from Arab countries also dropped sharply. Finally, the severe winter of 1991-2 had serious effects on agriculture, particularly in the West Bank. The recent economic recession in the occupied territories is clearly documented in figure 6.7, which shows (self-reported) changes in household income since the Gulf War.
Figure 6.7 Change in household income since the Gulf War in percent of households by region Two out of three households reported a decline in income, while only one out of twenty households experienced increased household income. Figure 6.7 also reveals that the number of households reporting a substantial decline in household income is particularly high in Gaza and in refugee camps, the areas most affected by the new Israeli restrictions on employment introduced during the war. Arab Jerusalem has the smallest proportion of households with reduced income, both escaping the curfew during the war and being less dependent on employment in Israel than Gaza and the West Bank. The effect of the Gulf War was thus not only a general recession in household income in the occupied territories, but a decline that hit the groups already worst off (Gaza and camps) the hardest.
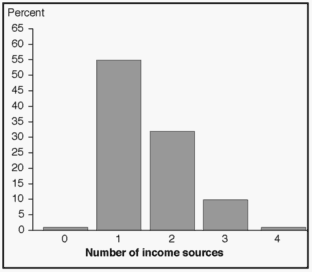
Sources of Household Income Household income types may be crudely divided into two main categories. The most important type of household income in the occupied territories by far, is labour activity. The importance of labour activity is particularly great because it is the most evenly distributed type of household income. Private and public transfers to households and capital income constitute the other main category of household income types. As will be shown below, transfers and capital income are, however, of less importance than income from labour activity. As can be seen from figure 6.8, most households receive only one type of income. (Note, however, that this income type, e.g. wages, may be received by more than one household member). Less than 1% of the households report no income, an interesting result taking the general problem of under-reporting of income into consideration.
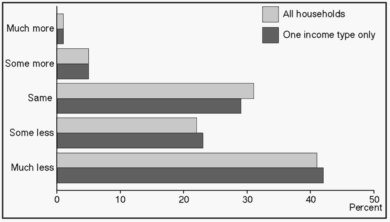
Figure 6.8 Number of income types of households in the occupied territories Figure 6.9 shows that changes in household income for households receiving only one type of income are very similar to the average for all households. Contrary to what could have been expected, there are no indications that these households have been harder hit by the economic decline since the Gulf War than other households.
Figure 6.9 Change in household income since the Gulf War in households with only one source of income
Income from labour activity9
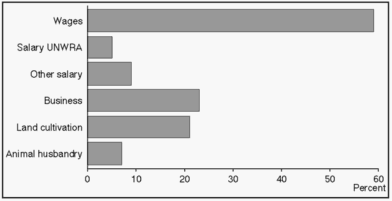
Figure 6.10 Percentage of households receiving labour income types The share of households receiving wage income increases, as can be expected, with the number of adult males residing in the households. Figure 6.11 shows that Gaza has a lower share of households receiving wage income than the West Bank and Arab Jerusalem. This difference, which persists also when camps are excluded from the respective areas, is most likely caused by the problematic labour market situation in Gaza.
Figure 6.11 Percent of households earning income from labour activity by region and type of locality
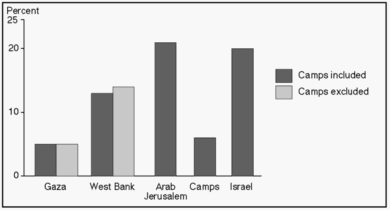
As a further illustration of the employment problems in Gaza, figure 6.12
shows the regional percentages of full-time employed persons out of the
total population in each area. ("Full-time" work is defined as
7 weeks or more of employment during the last two months prior to the survey). Figure 6.12 gives an approximate illustration of the ratio of consumers compared to producers in the occupied territories, expressing an important dimension of the prevailing economic problems in the area. While some of the difference between Israel and the occupied territories in total can be ascribed to different age structures in the two populations, age composition falls short of labour market problems as main explanation of the regional differences within the occupied territories. (See the subsequent chapter for a further discussion about employment problems).
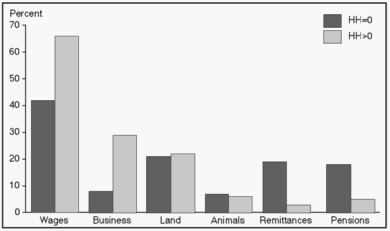
Figure 6.12 Full-time employed persons in percent of total population by region There are small variations by region or socio-economic group in the share of households receiving other types of labour income than wages. Salaries from UNRWA and agricultural income constitute the two main exceptions from this rule. The highest share of households receiving salaries from UNRWA are, as one could anticipate, found among UNRWA registered refugees, because UNRWA primarily provides salaried employment to UNRWA registered refugees. Income from land cultivation and animal husbandry is most frequent in West Bank villages. Quite naturally, shares of households receiving agricultural income are lowest in Arab Jerusalem and in camps, as urban residents usually possess no agricultural land. Labour income is, as mentioned above, the most common type of household income. In most households the labour activity of the Head of Household provides the bulk of labour income. An index for Head of Household labour activity, documented in a technical report available from FAFO, has therefore been constructed. The index gives a crude estimate of the Head of Household's labour income as a product of the expected wage level for his type of employment, multiplied with the duration of his work the year prior to the survey. Nearly 30% of the Household Heads had less than 1 month of labour activity the year prior to the survey. These will be referred to as "non-working" or "non-active" Household Heads in the discussion below. The remaining 70% have firstly been ranged according to estimated labour income during the previous year. Secondly, they have been divided into three equally sized groups of low, middle and high estimated income respectively. The distribution of the index for estimated Head of Household income by region and socio-economic group clearly shows the importance of the Head of Household's labour activity for the acquisition of household economic resources. The variational pattern of the estimated income index shows a fairly close resemblance to the index for household wealth (a correlation coefficient of 0.27 is estimated between the two indices). What is the share of households receiving labour income when the Head of Household does not work? To answer this question, the households in the occupied territories have been divided into two groups, namely households where the Household Head has no labour activity, and households where the Household Head is working. When a household with a non-working Head receives a particular type of labour income, this income type must stem from the labour activity of other household members. Figure 6.13 shows that the share of households receiving wages and business income is lower in households with a non-active Head than in other households. For agricultural income, though, there is no difference between the two groups.
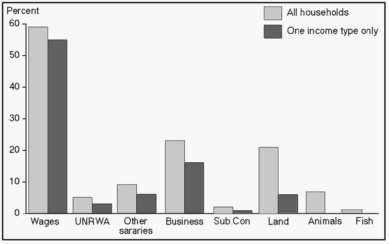
Figure 6.13 Household labour income by Head of Household labour activity A reasonable interpretation of figure 6.13 is that wages, and in particular business income, tend to stem from the labour activity of the Household Head himself. Still, many households receive wages from the labour activity of other household members. Which types of income from labour activity tend to be the only income type in households in the occupied territories? Figure 6.14 shows the share of households receiving various types of labour income as their only type of income, compared to the total share of households receiving these income types.
Figure 6.14 Percent of households receiving various labour income types for all households and households receiving only one type of income Figure 6.14 reveals that most households receiving wages and salaries, rely on these income types as their only source of income. It is less common to find business income as the only type of income. Agricultural income is even rarer as the only source of income, which goes to show that agricultural income generally plays a supplementary role in the household economy.
Transfers and Capital Income10
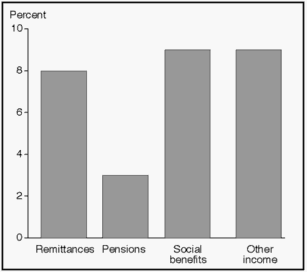
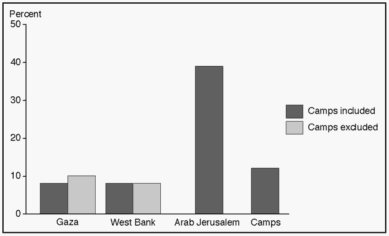
Figure 6.15 Percentage of households receiving non-labour income types There are small variations by region or socio-economic group in the share of households receiving non-labour income, except for social benefits. Figure 6.16 shows the regional percentages of households receiving social benefits.
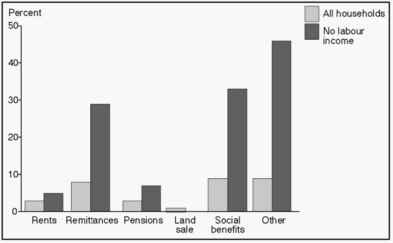
Figure 6.16 Percent of households receiving social benefits by region and type of locality The high rate of recipients of social benefits in Arab Jerusalem is clearly due to easy access to Israeli social security managements. In this connection it should be remembered that Arab Jerusalem enjoys a different status in Israeli law than Gaza and the West Bank. As opposed to these regions, the high share of households receiving social benefits in Arab Jerusalem does thus not necessarily express economic deprivation, at least not when compared to the other regions. It has been estimated that remittances constitute up to 1/3 of private disposable income in the occupied territories11. The share of households receiving remittances is particularly high among households with female Heads, indicating that their spouses are working abroad. As to regions, the share of households receiving remittances seems somewhat higher in the northern and central parts of the West Bank than in other areas. Capital income, in this survey comprising rent revenues and income from land sale, is received by a small number of households, and is the most unevenly distributed type of income recorded by the survey. Capital income in the occupied territories, as in most countries, generally increases with household wealth. What is the share of households receiving non-labour income when the Head of Household does not work? To answer this question, households where the Household Head has no labour activity have been compared to households where the Household Head is working. For transfers like social benefits, remittances and pensions we observe the inverse effect of the one found for for wage and business income. Figure 6.17 illustrates these results.
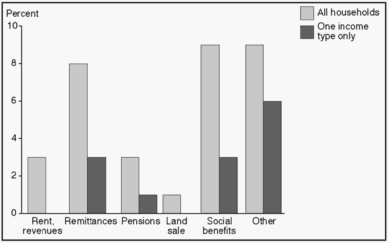
Figure 6.17 Household non-labour income by Head of Household labour activity The share of households receiving pensions increases when the Household Head is not working, as pensions obviously replace labour income for older Household Heads. Remittances are also more common in households with non-active Heads, because many of them are women with spouses working abroad. Social benefits are to a large extent received when or if the household lacks alternative income, for example from labour activity. Which types of non-labour income tend to be the only source of household income? Figure 6.18 shows the share of households receiving various types of non-labour income as their only type of income, compared to the total share of households receiving these income types.
Figure 6.18 Percent of households receiving various non-labour income types for all households and households receiving only one type of income Many households receiving capital income and transfers, also have other sources of income. One out of three households receiving remittances and social benefits, however, have no other means of income.
Household Wealth and Types of Family Income12
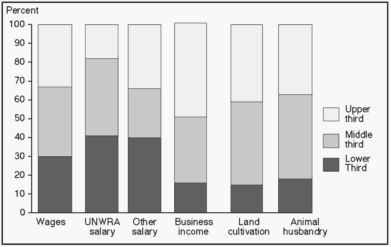
Figure 6.19 Household labour income types by household wealth
UNRWA salaries, social benefits, "other salaries" and "other
income", are income types mainly received by households belonging to
the lowest household wealth group. Most UNRWA employees are refugees, thus
explaining the high share of recipients in the lowest wealth group.
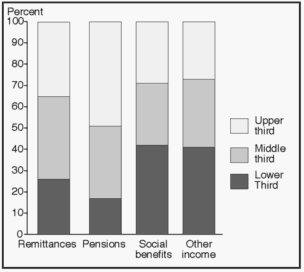
Figure 6.20 Household non-labour income types by household wealth Wages, which comprise everything from daily to monthly wages, are evenly distributed among the three household wealth groups. Note, however, the large size and the strong heterogeneity of this group, which comprises several substantially disparate sub-groups. Remittances, and in particular agricultural income, are over-represented in the middle household wealth group. Agricultural activity thus seems to secure households a satisfactory minimum level of economic resources.
Pensions, rent revenues and business income are mainly received by households
in the upper group of household wealth. For these types of income, the picture
is the same as can be found in other countries in the region. (A high share
of households receiving income from sub-contracting in the upper wealth
group may be due to random variation caused by small sample size).
|
 al@mashriq 960715 |
