|
Characteristics of Population in the Occupied Territories6What are the characteristic features of the population composition in the occupied territories? A straightforward answer to this question can hardly be given because the occupied territories, as already stated above (and further documented in the following chapters), comprise three main regions of substantial geographical and socio-economic heterogeneity. This section will give an overview of the three regions with regard to population density, type of locality, age, gender, religious distribution and household composition. The main aim of the section is to introduce and describe regions and socio-economic groups that will be used as references in subsequent chapters.
Population Density This figure illustrates the fundamental difference between Gaza and the West Bank with regard to population density. While Arab Jerusalem as a city can be expected to be densely populated, both the Gaza Strip and the West Bank were originally agricultural societies. In spite of an economic transformation through which wage labour gradually has replaced self-subsistence agriculture, large parts of the West Bank still have a rural character. The high population density of the Gaza Strip, on the contrary, has given the area a distinctive urban appearance.
Figure 2.2 Comparative 1987 population density in the occupied territories and Israel
Refugees Urban refugee camps are mainly situated around those population centers which remained under Arab control after the 1947-48 war. Today, most of the urban camps may be characterized as "urban slum areas" due to their physical and socio-economic resemblance to slum areas in other so-called developing countries. Rural refugee camps are situated in rural areas, and offer, in contrast to urban camps, the possibility of some agricultural activity for their inhabitants. Particularly in Gaza, the population composition was dramatically changed as a result of the 1947-48 war. A huge influx of approximately 200 000 refugees tripled the population in the area that came to be known as the Gaza Strip8. The high population density in Gaza is thus to a large extent due to events in 1948. Today, approximately two out of three persons in Gaza are UNRWA refugees. About one out of two refugees live in (mainly urban) refugee camps. The 1947-48 war had much less dramatic effects for the population composition of the West Bank. Today, one out of four persons in the West Bank is an UNRWA refugee, and more than two out of three refugees live outside camps. In Arab Jerusalem the refugee share is approximately the same as for the occupied territories in total9. Figure 2.3 show the distribution of the total population in the occupied territories according to refugee status.
Figure 2.3 Distribution of population by refugee status
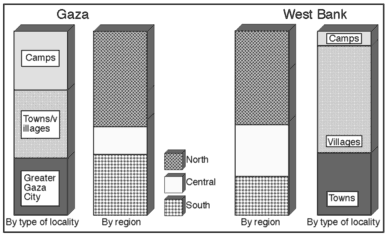
Type of Locality Greater Gaza City is, by far, the largest urban area in the occupied territories. Greater Arab Jerusalem (Arab Jerusalem and its West Bank suburbs) is the major urban conglomeration in the eastern part of the occupied territories, but comes out only second to Greater Gaza City in population10. Perhaps surprising to some observers, the third largest urban area in the occupied territories is constituted by the towns of Khan Younis and Rafah and adjacent camps, while Nablus, the most populous area in the West Bank proper, comes out fourth. In Gaza the middle region is the only area which still has a distinct rural appearance. For many so-called "villages" both in Gaza and Arab Jerusalem the label "village" has more historical than contemporary socio-economic relevance. Most of these "villages" (e.g. Silwan and Jabaliya) are in reality urban areas, and have consequently been classified as such. As opposed to Gaza and Arab Jerusalem the West Bank still contains a large rural population. Three out of five persons live in more than 400 villages and rural refugee camps. Small distances and relatively good communications, however, normally enable most of the rural population to reach larger towns within a few hours. More than half of the population in Gaza lives around Greater Gaza City in the northern part of the Strip. With more than 5000 persons per km2, this area has the highest population density in all of the occupied territories. The southern part of the Strip, comprising the towns of Khan Younis and Rafah, harbour approximately one third of the Gaza population. In the West Bank, too, more than half of the population resides in the northern part (Tulkarem, Jenin and Nablus sub-districts). The central part of the West Bank (Jericho, Ramallah and Bethlehem sub-districts) encircles Arab Jerusalem and comprises one fourth of the population. Somewhat less populated, Hebron sub-district constitutes the southern part of the West Bank.
Figure 2.4 Distribution of population in Gaza and the West Bank by sub-region and type of locality
In the present study the Gaza Strip was subdivided into Greater Gaza City (excluding refugee camps), other towns/ villages, and refugee camps. Easier access to the Israeli labor market for the inhabitants of Greater Gaza City, and the particular services provided by UNRWA for the population living in refugee camps, were among the considerations that prompted this classification. In the West Bank localities were grouped into towns, villages and refugee camps. Figure 2.4 show the distribution of the population in Gaza and the West Bank by type of locality and sub-region. Since 1948 intra-regional migration in the occupied territories has generally been small. Prior to 1967 migration was limited because Gaza, on the one hand, and the West Bank and East Jerusalem on the other, were ruled by Egypt and Jordan respectively. After the "reunification" through Israeli occupation in 1967, new restrictions on regional Palestinian population movements were introduced. In particular, Palestinian settlement in Arab Jerusalem has been constrained by Israeli restrictions on immigration and building permissions, leading to widespread "illegal" immigration. Even if the Palestinian population of Arab Jerusalem has doubled since 1967, its growth has still been lower than that of other Middle Eastern capital cities. The lack of housing in Arab Jerusalem has stimulated both "illegal" construction as well as out-migration of young Arab Jerusalem families to neighbouring West Bank towns and villages.
Religious Affiliation
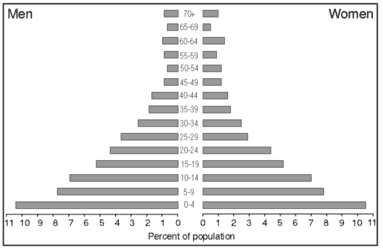
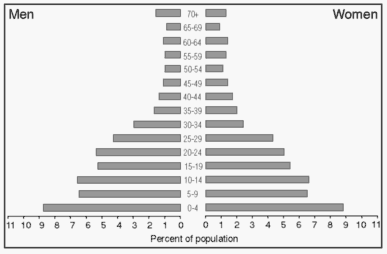
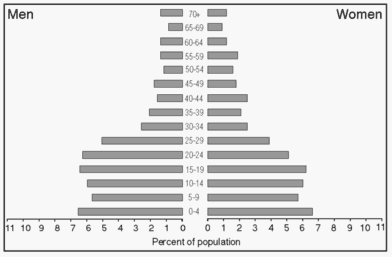
Age and Gender14 15 Figures 2.5a-c shows population pyramids which illustrate the distribution of the respective populations by five year age groups and gender, men to the left-hand side and women to the right. Comparison of results for separate five year age groups must be made with care due to the small sample size, in particular on the regional level. These regional pyramids can be compared to the overall age-sex distribution for the sample population, see figure 2.11. The overall gender distribution for Palestinians, 15 years or older, living in the occupied territories is almost exactly 50% male/female. There is a tendency of male over-representation in age groups 20-34 years, while there is an over-representation of females in the age groups 40-65 years. A possible explanation for the last result is an over-representation of males in labour related emigration during the seventies. Somewhat surprising is the fact that there is a weak male, rather than female, over- representation in the two oldest age groups. Note, however, that the sample size is small. The survey contains no information on the gender of children younger than 15 years. Assuming an approximately even number of female and male births, distribution on sex for these three five-year age intervals has simply been set to 1/2 male and 1/2 female. The young age structure of the population in the occupied territories is striking, but not particularly different from other Middle East countries. 46% of the population is aged 14 years or younger, 18% is aged 4 years or younger. In contrast to the distribution on gender, total results for the age distribution in the occupied territories disguise substantial regional differences. Gaza is the region with the youngest population. 51% of the population is 14 years or younger. As much as 21% of all Gazans are 4 years or younger. At the other end of the scale is Arab Jerusalem, with "only" 37% aged 14 years or younger and 13% aged 4 years or younger. The West Bank is the area with a relative age distribution most similar to that of the occupied territories in total. Note, however, that this result to some extent follows automatically because of the West Bank's large share of the total population in the occupied territories (60%). The "low" share of children below 5 years of age in Arab Jerusalem may partially be due to emigration of families with small children from Arab Jerusalem to the West Bank.
Figure 2.5a Distribution of population in Gaza,in five-year age groups by gender
Figure 2.5b Distribution of population in the West Bank, in 5-year age groups by gender
Figure 2.5c Distribution of population in Arab Jerusalem , in 5-year age groups by gender
Composition of Households16
Figure 2.6 Household composition by region and type of locality
Within Gaza, Greater Gaza City has the highest average number of children per adult household member. In the West Bank variations by sub-region and locality are small, except for a higher average number of children per adult in the southern part.
Figure 2.7 Household composition by refugee status
Figure 2.7 shows household composition by refugee status. For the occupied territories in total camp refugees seem to have a higher average number of persons per household than other groups. This result is, however, due to the high proportion of camp refugees living in Gaza, which generally comprise large households. In both Gaza and the West Bank variations by refugee status are smaller than the general regional variation. Contrary to the notions of many, both Gaza and West Bank refugee households have a lower average total number of members than do non-refugee households. In the Gaza Strip, households in camps actually have a lower average total number of members than both non-refugee households and refugee households outside camps. With regard to religious affiliation, Moslem households have on average more members than Christian households (7.6 and 4.7 respectively). In particular, the average number of children is higher in Moslem households (3.5), than in Christian households (1.5). The average number of children in Christian households is the lowest among all socio-economic groups analyzed in this section. However, the number of observations here is low, and estimates should be interpreted with caution. Household composition also varies systematically with the Head of Household's age. Average household size is smallest for young and old Household Heads, and greatest for middle-aged Heads of Households. As can be seen from Figure 2.8, this observation is valid both for the occupied territories taken as a whole and for each of the three main regions. For all Head of Household age groups Gaza has the highest, and Arab Jerusalem the lowest average number of household members.
Figure 2.8 Total number of persons in households by age of Head of Household
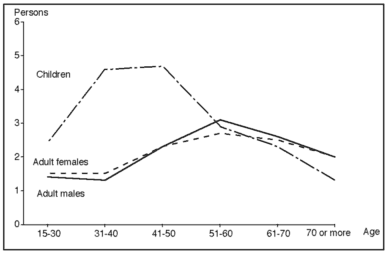
The variations in household composition with regard to the Head of Household's age can, of course, be explained by the usual life cycles of the household members. Figure 2.9 illustrates this point by showing the average number of adult males, females, and children for households in the occupied territories according to the age of the Head of Household.
Figure 2.9 Household composition by age of Head of Household
The typical household composition in the youngest Head of Household age group is one of few adults and few children, i.e. a group dominated by young couples with only one or two children. In the next Head of Household age group, the average number of children increases sharply, while the average numbers of adult males and females are stable. This group is likely to be dominated by single couples with an increasing number of own children. For the two next Head of Household age groups, the average number of children decreases markedly while the average number of adults shows a moderate increase. More and more children are growing older than 15 years of age, and are consequently being counted as adults. Sons may also marry, and their wives move in, hence a number of daughters-in-law are included among adult household members. Even more sons, however, move out to form households on their own.
Head of Household demographics19
|
 al@mashriq 960715 |


