|
|||||||||||||||||||||||||||||||||||||||||||||||||||||||||||||||||||||||||||||||||||||||||||||||||||||||||||||||||||||||||||||||||||||||||||||||||||||||||||||||||||
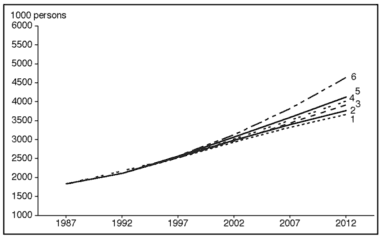
ResultsThe most striking aspect of the projections is that they indicate a very rapid population growth in the next 20 years, with nearly a doubling of the population, see table 2.18 and figures 2.11 and 2.13. This is the case for all alternative projections, almost regardless of fertility decline and migration assumptions. The reason for this is that the high past and current fertility rates have resulted in a large number of young people in the population. The total number of children borne by these persons in the future will be large, even if each individual has few children on average.
Table 2.18 Population projections
The annual growth rate for 1987 is estimated at 3.7%. For the end of the projection period, projections 1-5 show that an annual growth rate of 2%-3% is likely, even when fertility is assumed to decline.
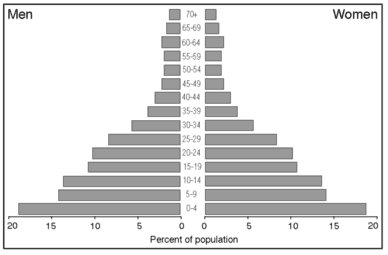
Figure 2.11 Age pyramid for the 1992 OT population, as estimated by FAFO living conditions survey Projection number 6 shows the largest growth (119 % since 1992), as expected by virtue of the assumptions it is based upon. This is, however, an unlikely development. It is presented here only to provide a likely upper limit for the projected population size. Similarly, projection 1 presents the smallest growth (73 %), providing a lower limit for the projected population size. The remaining projections (2-5) show a growth of 78% to 95% by the end of the projection period. The broad age structure of the population varies according to the underlying assumptions for each projection. Table 2.19 presents the distribution in three broad age groups (0-14, 15-64, and 65 +) together with the dependency ratio (number of persons 0-14 and 65+ per 100 persons 15-64) for 1992 and 2012.
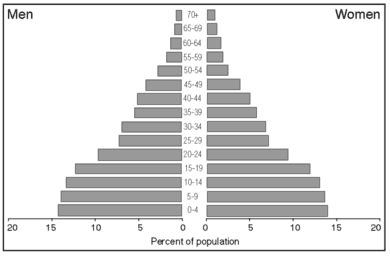
Figure 2.12 Age pyramid for the 2012 OT population, as estimated by projection 4 Even if one assumes that no drastic change in the political and economic situation will occur, job opportunities together with other conditions prevailing outside the area will probably continue to make people want to leave the occupied territories. However, given the restrictions imposed by both Israel and other countries on the free movement of Palestinians, the net emigration may be low. Although it is likely that fertility will continue to fall, increasing attachment to Islamic values may slow down the rate of decline.
Figure 2.13 Projections of OT population. Six alternative series Based on these and other arguments, we believe that projection 4 is the most realistic one, i.e., a moderate fertility decline and no net immigration. In the rest of this section, we will limit the presentation to results obtained from this projection unless otherwise stated.
Table 2.19 Dependency ratios at year 2012 for projections 1-6
|
|||||||||||||||||||||||||||||||||||||||||||||||||||||||||||||||||||||||||||||||||||||||||||||||||||||||||||||||||||||||||||||||||||||||||||||||||||||||||||||||||||
 al@mashriq 960715 | |||||||||||||||||||||||||||||||||||||||||||||||||||||||||||||||||||||||||||||||||||||||||||||||||||||||||||||||||||||||||||||||||||||||||||||||||||||||||||||||||||


